
Two-Axis Classification
Two numbers. Total obligated dollars and base contract count over a trailing 5-year window. The entire classification reduces to whether each number is above or below a fixed threshold.
| Class | Volume | Frequency | Structural property |
|---|---|---|---|
| Class 1 | High | High | Distributed revenue, repeatable wins, durable position |
| Class 2 | High | Low | Concentrated revenue, exposed to contract expiration |
| Class 3 | Low | High | Many small wins, demonstrated repeatability, growth trajectory |
| Class 4 | Low | Low | Limited activity, entry position or expired pipeline |
Population (n=779)
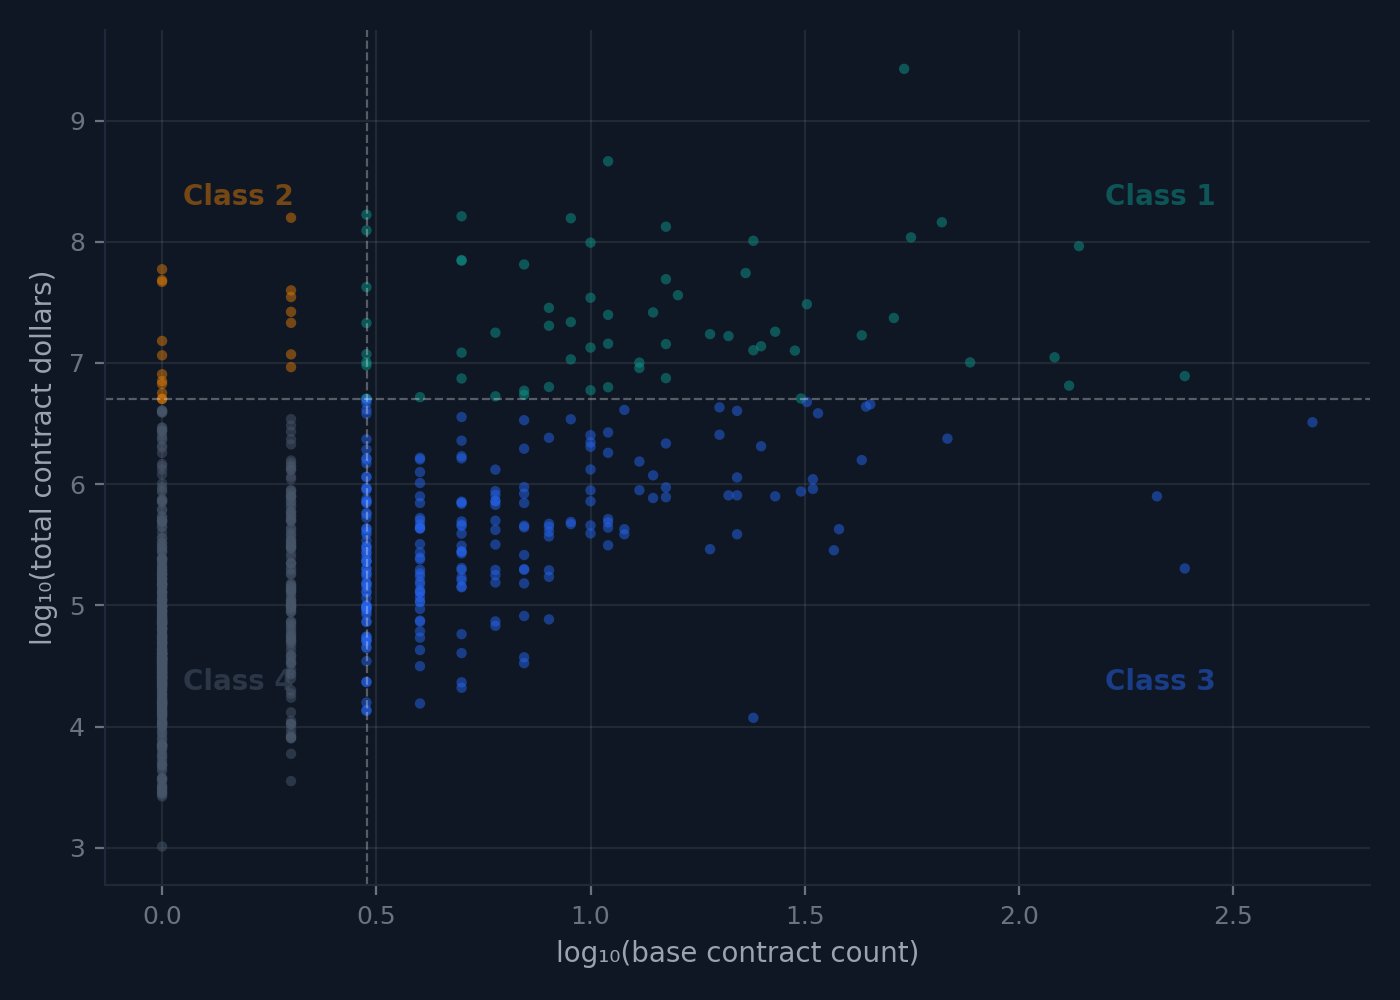
Each point is one Obligation-Verified contractor. Dashed lines indicate classification thresholds. 8.0% Class 1, 2.3% Class 2, 28.1% Class 3, 61.6% Class 4.
Obligation Density
Total contract dollars divided by base contract count. Two contractors with identical volume but different Obligation Densities represent fundamentally different positions that a single-axis ranking conflates.
Structural Fragility
The classification surfaces hidden contract expiration risk invisible in revenue rankings.
Concentration
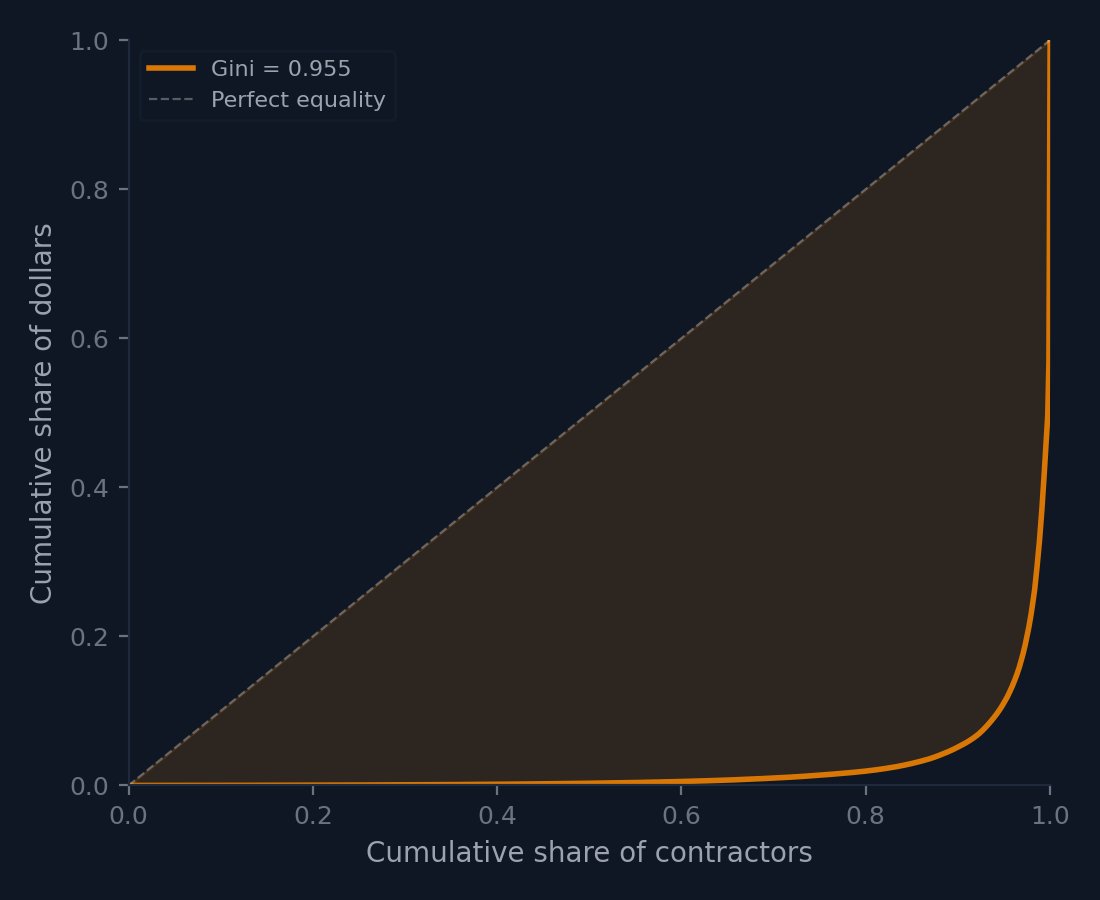
Gini coefficient: 0.955. Top 1% (7 contractors) hold 63.0% of all total contract dollars. Class 1 is 8.0% of the population and holds 86.7% of dollars.
Velocity
The 5-year window is split into an early period and a recent period. Velocity measures the rate of new contract wins, not the performance status of existing contracts.
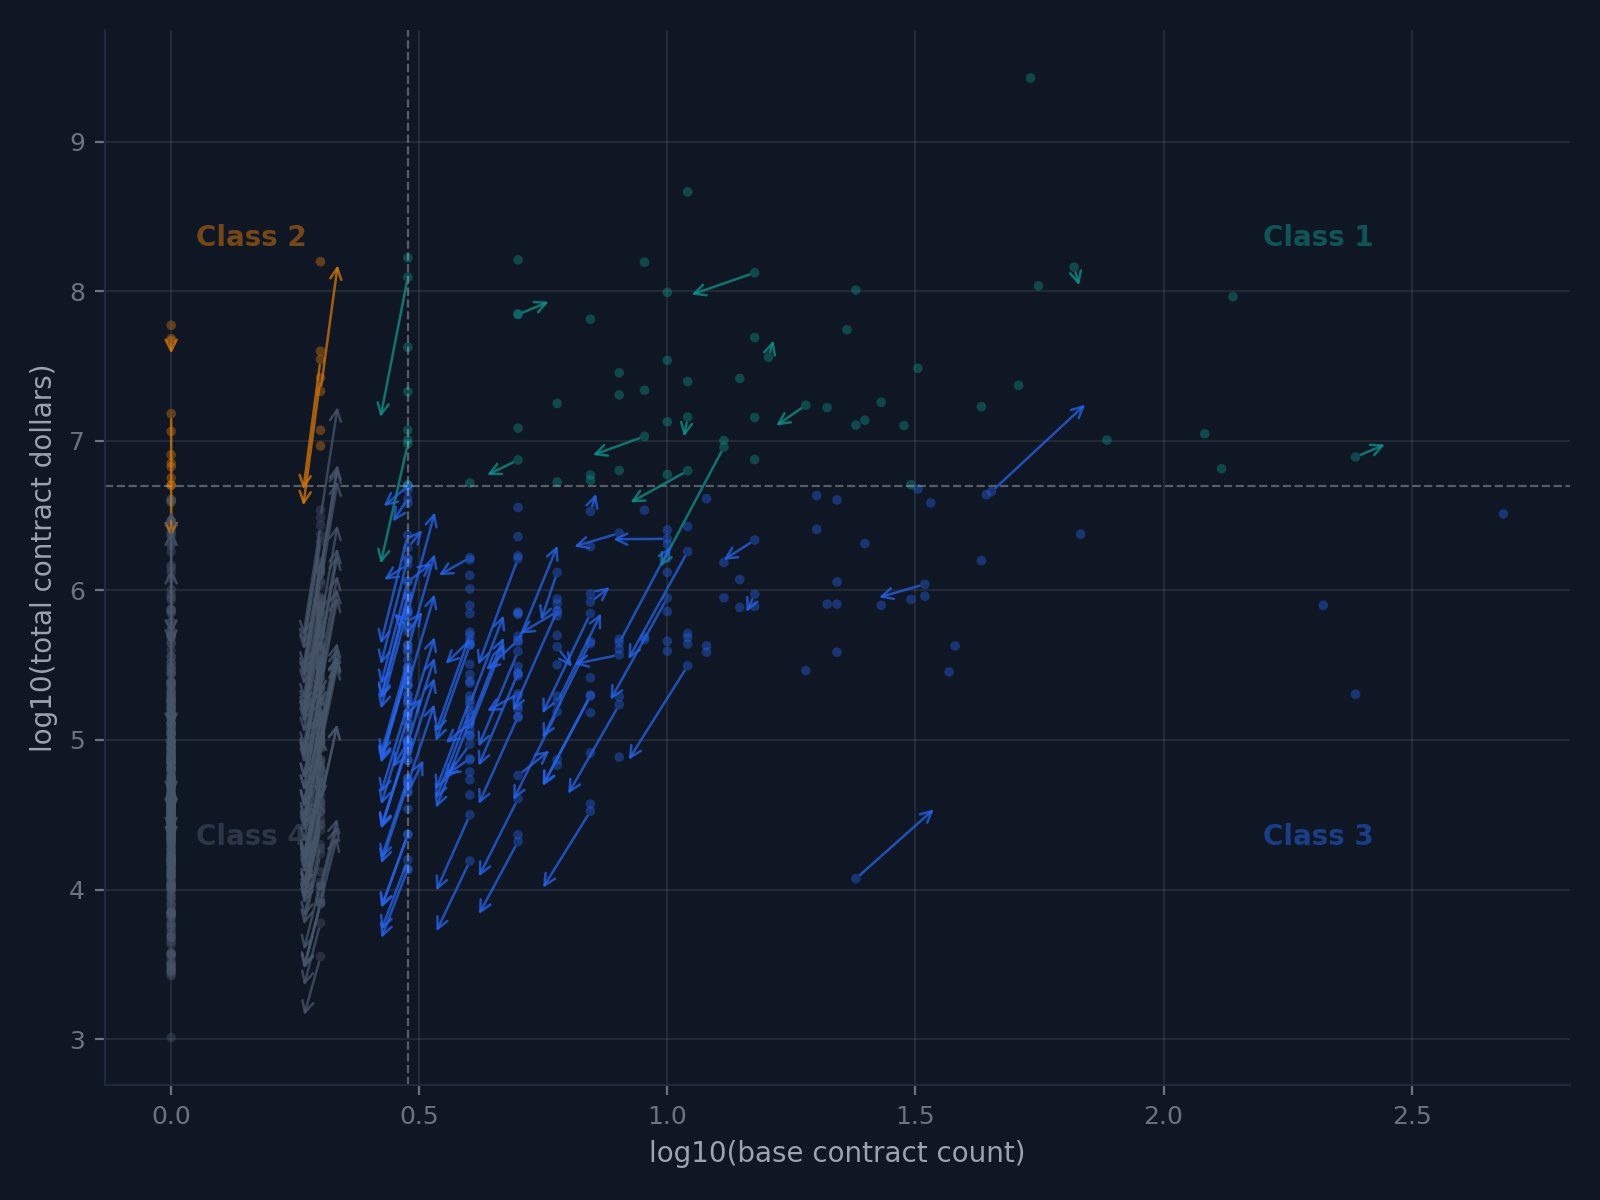
Velocity is computed two ways. The population charts use an aggregate method: the 5-year window is split at a fixed midpoint and early-period activity is compared to recent-period activity. Individual contractor profiles use a cadence-based method that measures each contractor's own award rhythm. Cadence requires 2+ contracts to compute a rhythm. The labels are: accelerating (winning faster than before), on pace (stable rhythm), slowing (longer gaps between wins), declining (significant drop-off), and inactive (no awards in 5+ gap cycles). Single-contract contractors have no cadence to measure.
Proximity Map
For each contractor, the six firms in the index that win the most similar contracts at the most similar scale. Derived from awarded contracts, not registration claims.
Code overlap. Each shared NAICS or PSC code weighted by 1/n2 where n = contractors holding that code. PSC codes carry 2x base weight. Rare code overlaps dominate.
Scale filter. Overlap multiplied by (min/max)2 of base contract volumes. A 1:10 mismatch decays to 1%. A 1:100 mismatch decays to 0.01%.
Neighborhood Density
The fraction of a contractor's Proximity Map neighbors that are also neighbors of each other. High density = crowded niche. Low density = crossroads between independent markets.
Class 2 avg density: 0.318. Class 1 avg density: 0.305. Concentrated revenue in concentrated markets vs systematic winners in diverse neighborhoods.
Proximity Pressure
Combines the Proximity Map with the velocity field. Neighbor velocity is computed only in shared procurement codes. Growth in unrelated codes is excluded.
77% of Class 1 in expansion (neighbors retreating in shared codes). 22% of Class 2 under compression despite holding high dollar volume.
Source Instruments
- USASpending.gov - obligations, PSC codes, awarding agency, contract award type
- SAM.gov - entity registration, certifications
The classification is derived from award data. Certification data enriches but does not gate. A contractor with USASpending award records is classified regardless of whether a matching SAM.gov record exists.
Exclusions
Not captured: subcontracting relationships, win rates, proposal quality, pricing strategy, or any non-public data. The classification is a function of disclosed base contract obligations only. The Proximity Map is observational: it maps procurement overlap, it does not model bidding behavior.
Applicable FAR Citations
| FAR 10.002(b)(1) | Source identification requirements |
| FAR 19.202-1 | Small business consideration mandate |
| FAR 7.105(b)(4) | Market research documentation |
| FAR 15.304 | Evaluation factors |
| FAR 33.103 | Bid protest auditability |
Data as of 2026-03-30. 779 contractors from 3794 registered entities. Updated on each classification run.